How do I customize my dashboard view?
Prerequisites
-
Dashboard is enabled for account
-
Project is online
-
Well has been published
Required Access Level
Project: Owner/Viewer
or
Dashboard: Viewer

Customize dashboard view
-
Open the ERALive Dashboard homepage in a browser window. View the well that you want to see data for.

-
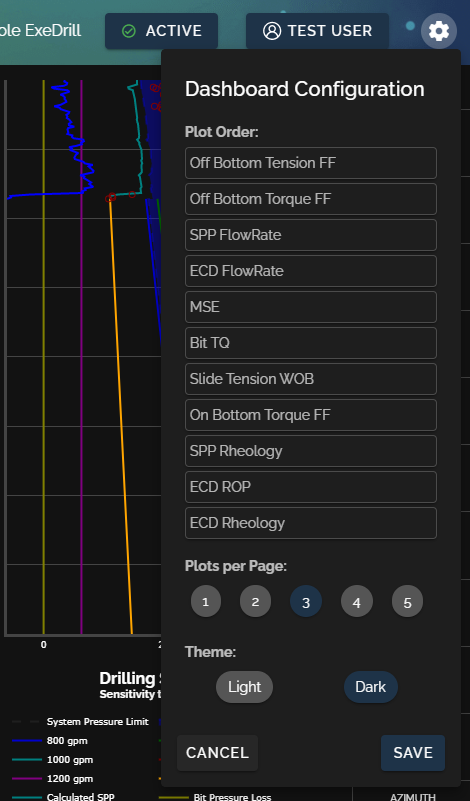
In the top right corner, click the settings gear to open a popover menu that displays settings relevant to the page you are viewing.

-
You are able to drag plots to put them in a different order, change the number of plots that are visible on screen, and toggle between light and dark themes. Changes do not apply until hitting save and settings are specific to the subop you are viewing (light/dark applies globally).